Device & Room Insights
Background
The charts query enables you to extract Device and Room Utilization Data & Insights from Poly Lens. This query gives you the ability to dig into the data at various levels of granularity to make informed decisions about your collaboration spaces and infrastructure. This query is highly flexible as it uses the same arguments and fields regardless of what you're targeting. This means you'll pass specific values to pull back Insights data for your use case and can expect the response structure to remain consistent. We'll break down the data structure and fields below and then provide example queries to help you test and explore the possibilities.
Arguments
The charts query contains the following required arguments. Values passed in are case-sensitive.
| Argument | Description | Type |
|---|---|---|
tenantId | Unique identifier of your Poly Lens Account (Tenant) | String! |
id | Unique identifier of the component you're analyzing. For example, a siteId, roomId, or deviceId. Must align with the locationScope's value (granularity level) | ID! |
locationScope | Defines the query scope (granularity level). Most commonly used: DEVICE, ROOM, SITE, TENANT. Also available, but less commonly used, VERSION, MODEL, MODEL_VERSION, DEVICE_TYPE, FAMILY, and ROOM_MEETING | Enum! |
timeScope | Specifies the time interval to analyze. Available values: DAY, WEEK, MONTH, QUARTER, YEAR | Enum! |
timeStart | The start time of the analyzation interval. Must align with the start of the timeScope in ISO 8601 standard | Scalar! |
topic | The Insight Topic (value) you're analyzing. Must align with the locationScope's available topics | ID! |
When using the charts query, the id, locationScope, and topic must align with each other. For example, if you're targeting a device's Insights, id = deviceId, locationScope = DEVICE, topic = available Device Insights topic.
Fields
There are three charts fields you can utilize to return specific data sets: invocationId, meta and series.
InvocationId Field
This serves as a trace ID for debugging queries and can be valuable in troubleshooting potential issues.
{
  "data": {
    "charts": {
      "invocationId": "a2267878-t9a3-6eb7-89ff-a49vfe8pl24w"
    }
  }
}
Meta Fields
Meta Fields provide metadata for the specific chart you're querying. While there are three possible types, the InsightChartMeta array provides the most prevalent metadata for most charts queries. Within the InsightChartMeta type you have access to the following.
| Field | Description | Type |
|---|---|---|
aggType | Indicates the aggregation type used for the chart - AVERAGE, COUNT, PERCENTAGE, TOTAL | Enum! |
childCount | Represents the number of entities, such as devices or rooms, that have contributed to a specific topic. | Float! |
increment | Specifies the time interval used to retrieve data - HOUR, DAY, WEEK, MONTH, YEAR | Enum! |
otherCount | Represents the number of additional entities, such as devices or rooms, that have contributed to a specific topic beyond the top 3, or 0 if the count is 3 or less | Float! |
timeScope | The temporal range for which the data is expected - DAY, WEEK, MONTH, QUARTER, YEAR | Enum! |
topic | Specifies the topic or value the chart represents (the value passed into the query topic argument) | String! |
When you add meta fields to your query you'll notice three ellipses inside the meta object. This syntax is similar to the JavaScript spread operator and tells GraphQL to assign the fields from the fragment to the current selection set. This convention is one of the benefits of GraphQL's relational structure - it allows us to pull specific metadata into the chart for the id we're targeting.
meta {
        ... on InsightSeriesMeta {
          locationScope
          object {
            ... on Device {
              name
              id
            }
          }
        }
      }
Series Fields
The series fields contain data, meta, and name fields. The data array is what you'll leverage to build a chart or table.
When used in a query, the data response object returns an array of objects (a point in the series) you can use to plot the data. Each object (point) is based on the timeScope and timeStart. This structure provides flexibility in utilizing the data in a user interface chart, table, or other ways relevant to your use case. The example below shows a single object (point) within the series data array for a room charts query with a timeScope of "YEAR" and timeStart of "2023-01-01T00:00:00.000Z".
  "data": {
    "charts": {
      "series": [
        {
          "name": "Room 12a3bc4d-56ef-78gh-9102-ij3kl4lm67891",
          "data": [
            {
              "count": 5360.85882761,
              "total": 2884,
              "x": "2023-01-01T00:00:00.000Z",
              "y": 1.85882761,
              "z": null
            }
          ]
        }
      ]
    }
  }
The series meta field allows you to target specific fields on the chartsId object without running a subsequent query, i.e., name, id, location, etc. This data is useful when building user interfaces focused on charts data.
{
  "data": {
    "charts": {
      "__typename": "Chart",
      "series": [
        {
          "data": [
            {
              "x": "2023-05-28T00:00:00.000Z",
              "y": 1.00166003,
              "z": null,
              "count": 18102,
              "total": 18072
            }
          ],
          "meta": {
            "locationScope": "ROOM",
            "object": {
              "name": "Small Room - Studio x30",
              "capacity": 3
            }
          }
        }
      ]
    }
  }
}
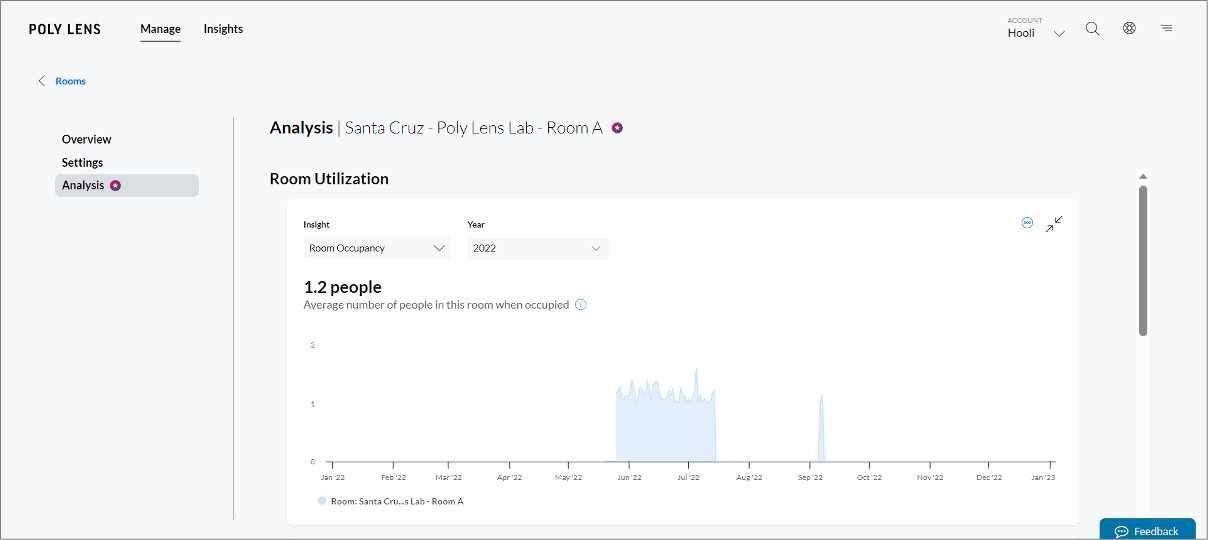
To give you a visual example, this is how we display the series data in a chart in the Poly Lens cloud.
Device Insights
Device Insights provide data for Device Adoption and Health Insights. When using the charts query to target device data, change locationScope to DEVICE, chartsId to the deviceId, and topic to the Insight Topic (value) you're targeting. Reference the tables below for available Device Insights Topics.
Device Adoption
| Insight | Description | Topic (value) |
|---|---|---|
| Call Use | The average time the device was in calls each day | Call Usage |
| Devices Used | Percent of days this device made at least one call | Devices Used |
| Devices Unused | Percent of days the device was online but made no calls | Devices unused |
Device Health
| Insight | Description | Topic (value) |
|---|---|---|
| Devices Offline | Percent of days the device experienced an offline state | Offline devices |
| Devices Out-of-service | Percent of days the device was continuously offline | Devices out of service |
Charts Query - Device's Call Use
We'll walk through an example query for a common use case - targeting the average time a device was in calls. In this example, we'll target the timeScope of "WEEK".
Test this query in the GraphQL Playground
query deviceCharts(
  $tenantId: [String!]!
  $chartsId: ID!
  $locationScope: LocationScope!
  $timeScope: TimeScope!
  $timeStart: Date!
  $topic: ID!
) {
  charts(
    tenantId: $tenantId
    id: $chartsId
    locationScope: $locationScope
    timeScope: $timeScope
    timeStart: $timeStart
    topic: $topic
  ) {
    series {
      name
      data {
        count
        total
        x
        y
        z
      }
    }
    meta {
      ... on InsightChartMeta {
        topic
        aggType
        timeScope
        increment
        childCount
        otherCount
      }
    }
  }
}
Variables
{
  "tenantId": "695xxx-bxx-4xxx-ax2x-1xxxxx", //tenantId
  "chartsId": "00x1xe5x3xad4", //Studio x50 device ID
  "locationScope": "DEVICE", //level at which data is queried. set to "DEVICE" for this room charts query
  "timeScope": "WEEK", //time range for which data is expected
  "timeStart": "2023-01-22T00:00:00.000Z", //needs to align with the timeScope you define. Since we've chosen "YEAR" above, our "timeStart" is the first day of the Year
  "topic": "Call Usage" //Value is case-sensitive
}
Response
{
  "data": {
    "charts": {
      "series": [
        {
          "name": "Device 00e0db506ad4",
          "data": [
            {
              "count": 0,
              "total": null,
              "x": "2023-01-22T00:00:00.000Z",
              "y": 0,
              "z": null
            },
            {
              "count": 106,
              "total": null,
              "x": "2023-01-23T00:00:00.000Z",
              "y": 106,
              "z": null
            },
            {
              "count": 0,
              "total": null,
              "x": "2023-01-24T00:00:00.000Z",
              "y": 0,
              "z": null
            },
            {
              "count": 74,
              "total": null,
              "x": "2023-01-25T00:00:00.000Z",
              "y": 74,
              "z": null
            },
            {
              "count": 23,
              "total": null,
              "x": "2023-01-26T00:00:00.000Z",
              "y": 23,
              "z": null
            },
            {
              "count": 38,
              "total": null,
              "x": "2023-01-27T00:00:00.000Z",
              "y": 38,
              "z": null
            },
            {
              "count": 0,
              "total": null,
              "x": "2023-01-28T00:00:00.000Z",
              "y": 0,
              "z": null
            }
          ],
          "meta": {
            "locationScope": "DEVICE",
            "object": {
              "name": "DFR Studio x50",
              "id": "00e0db506ad4"
            }
          }
        }
      ],
      "meta": {
        "topic": "Call Usage",
        "aggType": "COUNT",
        "timeScope": "WEEK",
        "increment": "DAY",
        "childCount": 0,
        "otherCount": 0
      }
    }
  }
}
In the example response above, you'll notice the response returned a data object with an array of seven objects (a point in the series), one for each day of the week. Within each object, count and y represent the total number of minutes the device was in a call and x represents the date. The meta object returned shows the specific values for this chart query.
Room Insights
Room Insights provide data for Room Utilization or Meeting Behavior. When using the charts query to target room data, change locationScope to ROOM, chartsId to the roomId, and topic to the value of the Insights Topic you're targeting. Reference the tables below for available Room Insights Topics.
Room Utilization
| Insight | Description | Topic (value) |
|---|---|---|
| Room Occupancy | The average number of people in the room when occupied | Average meeting size |
| Room Use | The average time the room was used each day | Room usage |
Meeting Behaviors
| Insight | Description | Topic (value) |
|---|---|---|
| Room Scheduled, but Unused | Room was scheduled for a meeting but was not used | Rooms scheduled but not used |
| Room Scheduled in a Series, but Unused | Room is scheduled for recurring meetings but was not used | Recurring meetings with no participants |
| Meetings That Were Unscheduled | Room was used for an unscheduled meeting | Unscheduled room usage |
| Meetings That Ran Long | Room was used for a meeting that ran longer than planned | Meetings that run long |
| Meetings That Started Late | Room was used for a meeting that started late | Meetings that start late |
The use of Meeting Behaviors Topics requires Office 365 Calendar integration for the room. Without this integration, the query will return a null response object.
Charts Query - Average meeting size
Let's walk through a common use case for a room charts query - targeting "people count" in the room. We'll use the Average meeting size topic value and the timeScope of "WEEK" to target this data.
Test this query in the GraphQL Playground
query roomCharts(
  $tenantId: [String!]!
  $chartsId: ID!
  $locationScope: LocationScope!
  $timeScope: TimeScope!
  $timeStart: Date!
  $topic: ID!
) {
  charts(
    tenantId: $tenantId
    id: $chartsId
    locationScope: $locationScope
    timeScope: $timeScope
    timeStart: $timeStart
    topic: $topic
  ) {
    __typename
    series {
      data {
        x
        y
        z
        count
        total
      }
      meta {
        ... on InsightSeriesMeta {
          locationScope
          object {
            ... on Room {
              name
            }
          }
        }
      }
    }
    meta {
      ... on InsightChartMeta {
        topic
        aggType
        timeScope
        increment
        childCount
        otherCount
      }
    }
  }
}
Variables
{
  "tenantId": "12xxxxxx-xxxx-xxxx-xxxx-xxxxxxxxxx589", //tenantId
  "chartsId": "68xxxxxx-xxxx-xxxx-xxxx-xxxxxxxxx503", //roomId - the unique identifier of location scope
  "locationScope": "ROOM", //level at which data is queried. set to "ROOM" for this room charts query
  "timeScope": "YEAR", //time range for which data is expected
  "timeStart": "2023-01-01T00:00:00.000Z", //starting point for data retrieval. should match the start of the `timeScope`
  "topic": "Offline devices" //metric to analyze. topic value available for chart type
}
Response
{
  "data": {
    "charts": {
      "__typename": "Chart",
      "series": [
        {
          "data": [
            {
              "x": "2023-05-28T00:00:00.000Z",
              "y": 1.00166003,
              "z": null,
              "count": 18102,
              "total": 18072
            },
            {
              "x": "2023-05-29T00:00:00.000Z",
              "y": 1.00134607,
              "z": null,
              "count": 46122,
              "total": 46060
            },
            {
              "x": "2023-05-30T00:00:00.000Z",
              "y": 1.44985817,
              "z": null,
              "count": 78201,
              "total": 53937
            },
            {
              "x": "2023-05-31T00:00:00.000Z",
              "y": 1.45103225,
              "z": null,
              "count": 70777,
              "total": 48777
            },
            {
              "x": "2023-06-01T00:00:00.000Z",
              "y": 1.33629163,
              "z": null,
              "count": 68660,
              "total": 51381
            },
            {
              "x": "2023-06-02T00:00:00.000Z",
              "y": 1.34407777,
              "z": null,
              "count": 72861.11187839,
              "total": 54209
            },
            {
              "x": "2023-06-03T00:00:00.000Z",
              "y": 1.02478134,
              "z": null,
              "count": 2109,
              "total": 2058
            }
          ],
          "meta": {
            "locationScope": "ROOM",
            "object": {
              "name": "Small Room - Studio x30"
            }
          }
        }
      ],
      "meta": {
        "topic": "Average meeting size",
        "aggType": "AVERAGE",
        "timeScope": "WEEK",
        "increment": "DAY",
        "childCount": 0,
        "otherCount": 0
      }
    }
  }
}
You'll notice the response returned a data object with an array of seven objects (a point in the series), one for each day of the week. Within each object:
- x is the date
- y is the average (
count/total) - z will remain null in most cases (small people count number and/or for a future timeframe)
- count is the total number of people-seconds within the timeframe
- total is the number of meeting-seconds within the timeframe
The series meta object shows the specific values for this chart and allows us to target specific fields on the object, like the name.
The other meta object returned shows the specific values for this chart query.
If you have questions about usage, authentication, or integration with the Poly Lens APIs, contact us.